- Delivered year-over-year EBITDA growth for the first time in more than five years
- Added record number of fiber broadband customers as the un-cable provider
- Raised cost savings target by $100 million one year ahead of plan
NORWALK, Conn., May 5, 2023 — Frontier Communications Parent, Inc. (NASDAQ: FYBR) (“Frontier”) reported first-quarter 2023 results today.
“We delivered another strong quarter and reached a critical milestone in our transformation. Thanks to our team’s consistent operational performance, we achieved EBITDA growth for the first time in five years,” said Nick Jeffery, President and Chief Executive Officer of Frontier.
“We are creating an internet company that people love. Over the last two years, we have rallied around our purpose of Building Gigabit America, invested in fiber, enhanced our product, put the customer at the center of everything we do and made it easier to do business with us. We are quickly becoming an agile, digital infrastructure company, and I’m confident we will return to growth this year.”
First-Quarter 2023 Highlights[1]
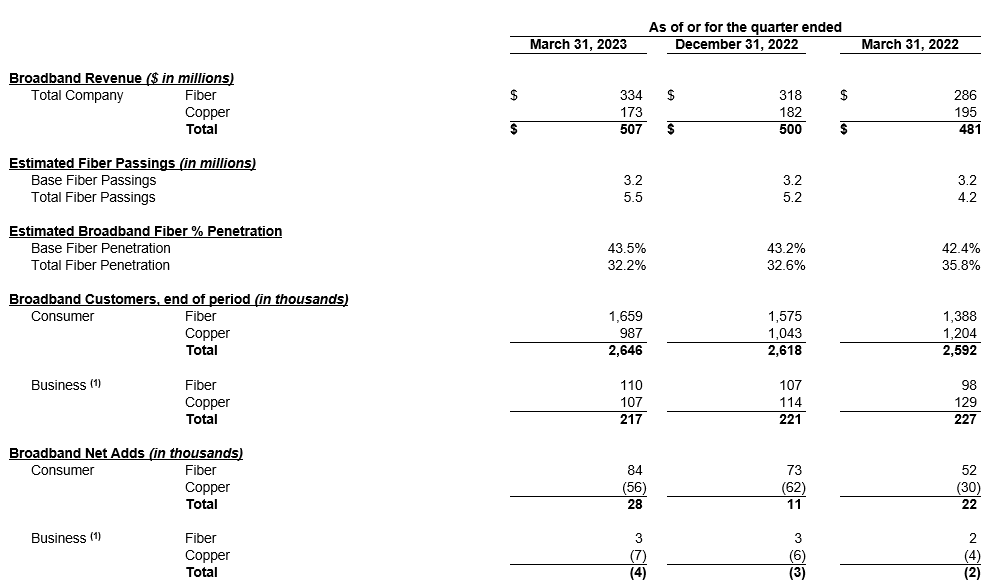
- Built fiber to 339,000 locations
- Added a record 87,000 fiber broadband customers, resulting in fiber broadband customer growth of 19% from the first quarter of 2022
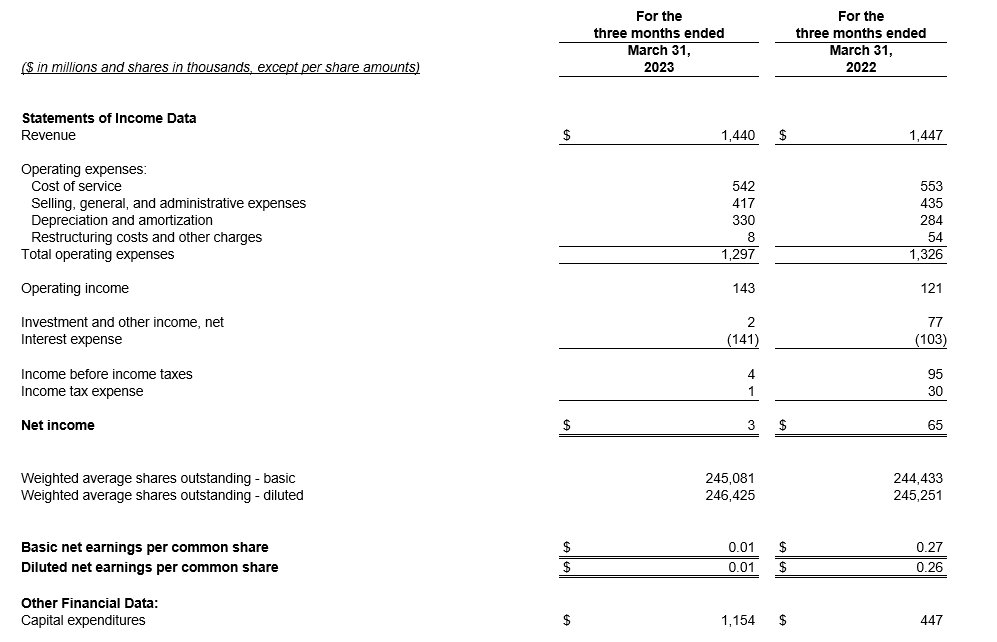
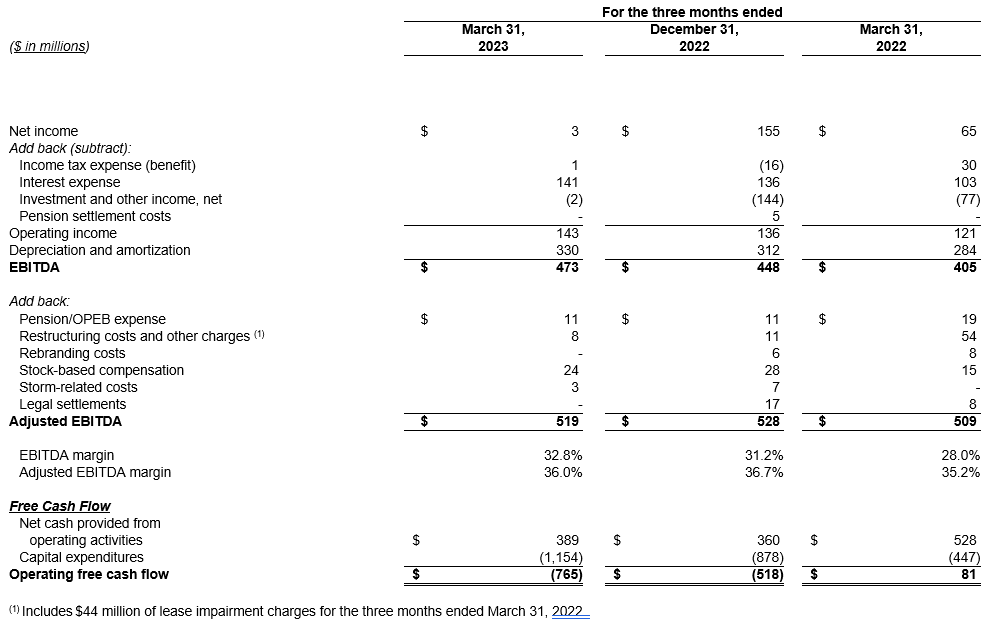
- Revenue of $1.44 billion, net income of $3 million and Adjusted EBITDA of $519 million
- Capital expenditures of $1.15 billion, including $523 million of non-subsidy-related build capital expenditures and $37 million of subsidy-related build capital expenditures
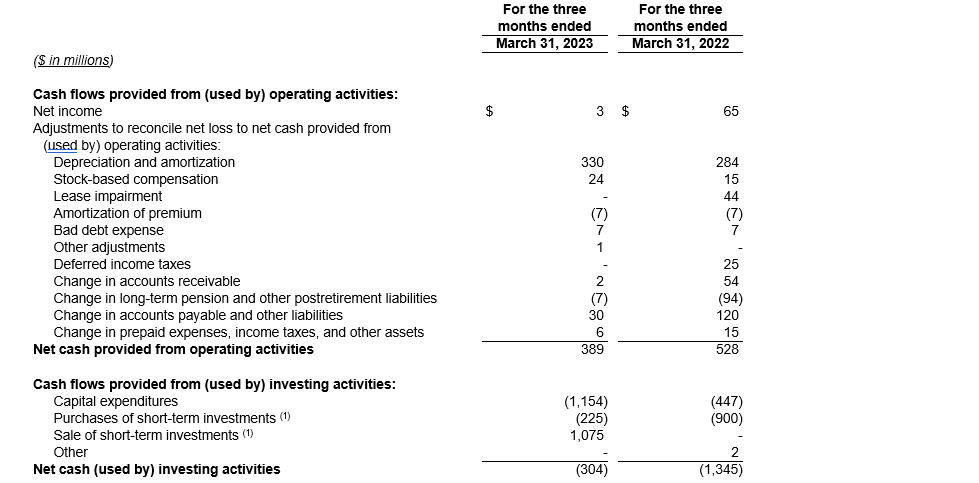
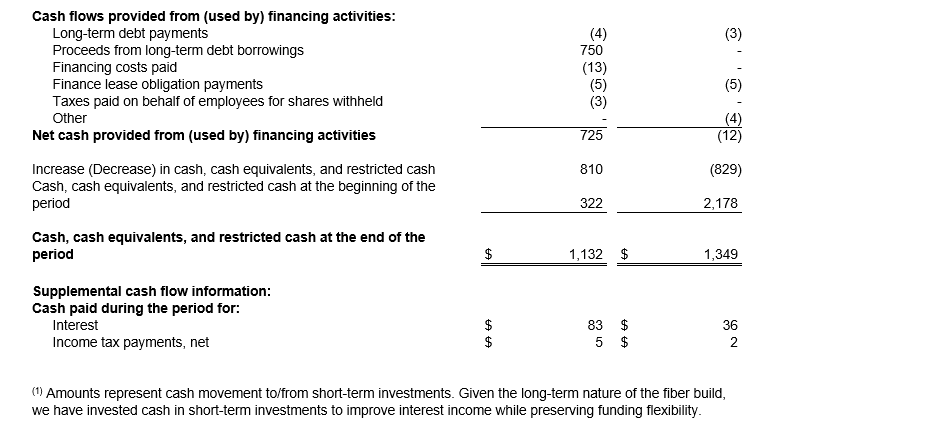
- Net cash from operations of $389 million driven by strong operating performance and increased focus on working capital management
- Achieved annualized run-rate cost savings of $398 million and raised cost savings target to $500 million by the end of 2023
- Ranked No. 1 for the fastest internet upload speeds in the U.S. according to Ookla Speedtest results from the first quarter of 2023
First-Quarter 2023 Consolidated Financial Results
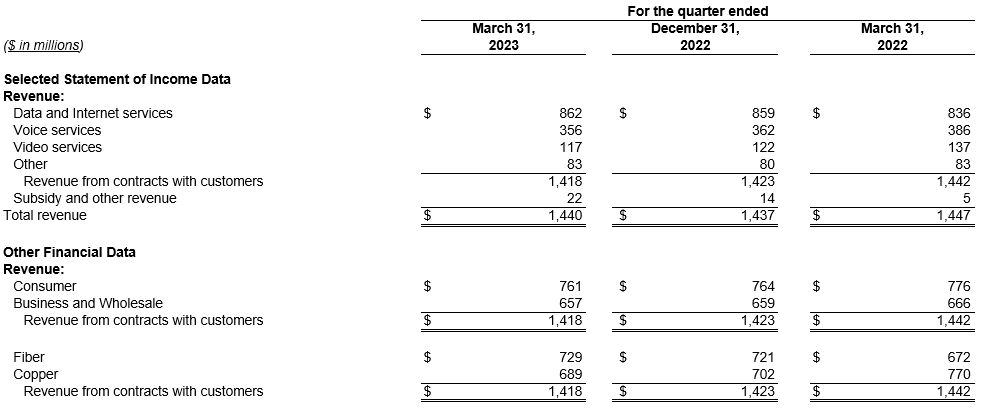
- Revenue of $1.44 billion decreased 0.5% from the first quarter of 2022 as growth in consumer, business and wholesale fiber was more than offset by declines in legacy copper
- Operating income was $143 million and net income was $3 million
- Adjusted EBITDA of $519 million increased 2.0% over the first quarter of 2022 as revenue declines were more than offset by lower content, selling, general and administrative expenses, and cost-saving initiatives
- Adjusted EBITDA margin of 36.0% increased from 35.2% in the first quarter of 2022
- Capital expenditures of $1.15 billion increased from $0.45 billion in the first quarter of 2022 as fiber expansion initiatives accelerated
First-Quarter 2023 Consumer Results
- Consumer revenue of $761 million decreased 1.9% from the first quarter of 2022 as strong growth in fiber broadband was more than offset by declines in legacy copper broadband and voice
- Consumer fiber revenue of $448 million increased 10.1% over the first quarter of 2022 as growth in consumer broadband, voice, and other more than offset declines in video
- Consumer fiber broadband revenue of $298 million increased 17.3% over the first quarter of 2022 driven by growth in fiber broadband customers
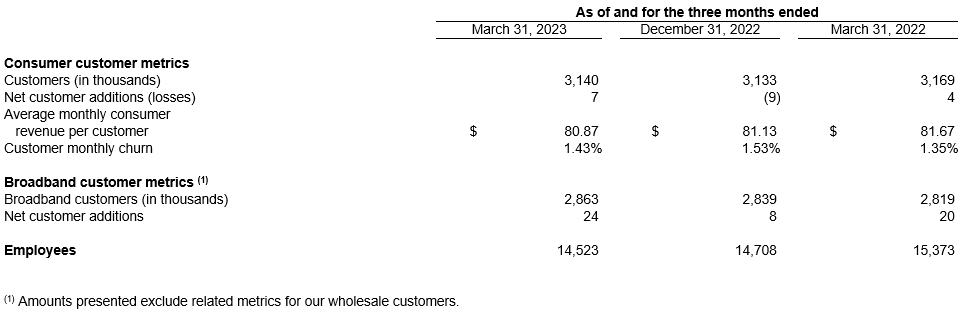
- Consumer fiber broadband customer net additions of 84,000 resulted in consumer fiber broadband customer growth of 19.5% from the first quarter of 2022
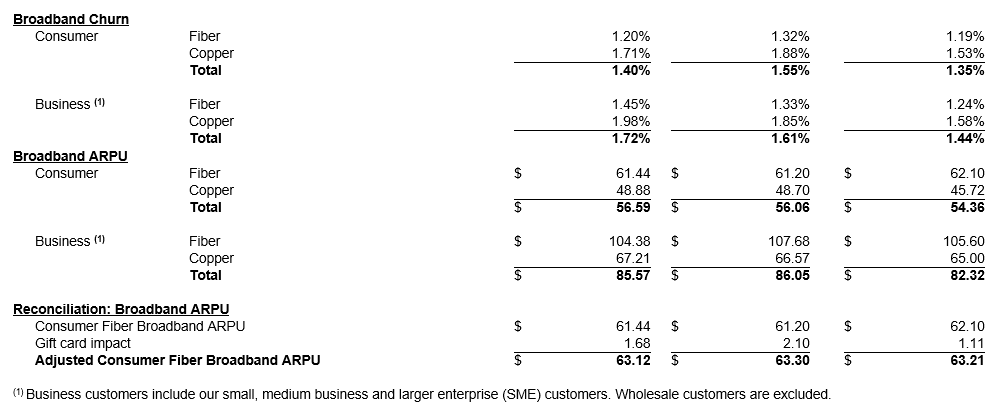
- Consumer fiber broadband customer churn of 1.20% was roughly flat with churn of 1.19% in the first quarter of 2022
- Consumer fiber broadband ARPU of $61.44 decreased 1.1% from the first quarter of 2022 driven primarily by the autopay and gift-card incentives introduced in the third quarter of 2021
First-Quarter 2023 Business and Wholesale Results
- Business and wholesale revenue of $657 million decreased 1.4% from the first quarter of 2022 as growth in fiber was more than offset by declines in copper
- Business and wholesale fiber revenue of $281 million increased 6.0% over the first quarter of 2022 as growth in business was partly offset by modest declines in wholesale
- Business fiber broadband customer churn of 1.45% increased from 1.24% in the first quarter of 2022
- Business fiber broadband ARPU of $104.38 decreased 1.2% from the first quarter of 2022
Capital Structure[2]
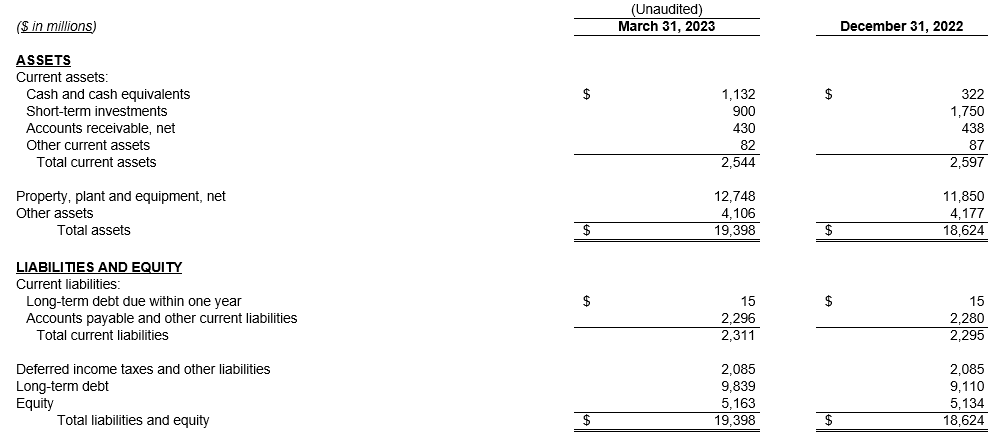
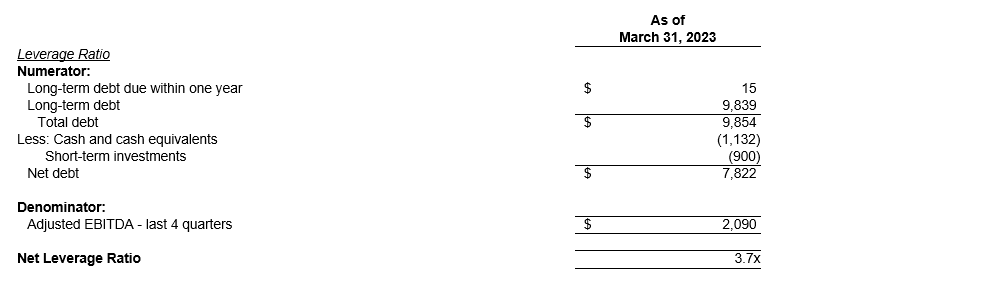
At March 31, 2023, Frontier had total liquidity of $2.7 billion, including a cash and short-term investments balance of approximately $2.0 billion and $0.7 billion of available borrowing capacity on its revolving credit facility. Frontier’s net leverage ratio on March 31, 2023 was approximately 3.7x. Frontier has no long-term debt maturities prior to 2027.
2023 Outlook[3]
Frontier today updated guidance for capital expenditures and interest expense, while reaffirming all other operational and financial expectations for 2023.
Frontier’s guidance for the full year 2023 is:
- Adjusted EBITDA of $2.11 – $2.16 billion, unchanged from prior guidance
- Fiber build of 1.3 million new locations, unchanged from prior guidance
- Cash capital expenditures of $3.00 – $3.20 billion, an increase from prior guidance of $2.80 billion, reflecting higher inventory levels and fiber build costs
- Cash taxes of approximately $20 million, unchanged from prior guidance
- Net cash interest payments of approximately $655 million, an increase from prior guidance of $630 million, reflecting the $750 million of debt raised in March 2023
- Pension and OPEB expense of approximately $50 million (net of capitalization), unchanged from prior guidance
- Cash pension and OPEB contributions of approximately $125 million, unchanged from prior guidance
Conference Call Information
As previously announced, Frontier will host a conference call with the financial community to discuss first-quarter 2023 results today, May 5, 2023, beginning at 8:30 a.m. Eastern Time.
The conference call webcast and presentation materials are accessible through Frontier’s Investor Relations website and will remain archived at this location.
Investor Contact
Spencer Kurn
SVP, Investor Relations
+1 401-225-0475
spencer.kurn@ftr.com
Media Contact
Chrissy Murray
VP, Corporate Communications
+1 504-952-4225
chrissy.murray@ftr.com
About Frontier
Frontier is leading the “un-cable” revolution. Driven by our purpose, Building Gigabit America, we are relentless in our pursuit of always delivering a better customer experience. Providing digital infrastructure that empowers people to create the future, we’re connecting millions of consumers and businesses in 25 states with reliable fiber internet and multi-gigabit speeds. For more information, visit www.frontier.com.
Non-GAAP Financial Measures
Frontier uses certain non-GAAP financial measures in evaluating its performance, including EBITDA, EBITDA margin, Adjusted EBITDA, Adjusted EBITDA margin, operating free cash flow, adjusted operating expenses, and net leverage ratio, each of which is described below. Management uses these non-GAAP financial measures internally to (i) assist in analyzing Frontier’s underlying financial performance from period to period, (ii) analyze and evaluate strategic and operational decisions, (iii) establish criteria for compensation decisions, and (iv) assist in the understanding of Frontier’s ability to generate cash flow and, as a result, to plan for future capital and operational decisions. Management believes that the presentation of these non-GAAP financial measures provides useful information to investors regarding Frontier’s financial condition and results of operations because these measures, when used in conjunction with related GAAP financial measures, (i) provide a more comprehensive view of Frontier’s core operations and ability to generate cash flow, (ii) provide investors with the financial analytical framework upon which management bases financial, operational, compensation, and planning decisions, and (iii) present measurements that investors and rating agencies have indicated to management are useful to them in assessing Frontier and its results of operations.
A reconciliation of these measures to the most comparable financial measures calculated and presented in accordance with GAAP is included in the accompanying tables. These non-GAAP financial measures are not measures of financial performance or liquidity under GAAP, nor are they alternatives to GAAP measures, and they may not be comparable to similarly titled measures of other companies.
EBITDA is defined as net income (loss) less income tax expense (benefit), interest expense, investment and other income (loss), pension settlement costs, reorganization items, and depreciation and amortization. EBITDA margin is calculated by dividing EBITDA by total revenue.
Adjusted EBITDA is defined as EBITDA, as described above, adjusted to exclude certain pension/OPEB expenses, restructuring costs and other charges, stock-based compensation, and certain other non-recurring items. Adjusted EBITDA margin is calculated by dividing Adjusted EBITDA by total revenue.
Management uses EBITDA, EBITDA margin, Adjusted EBITDA and Adjusted EBITDA margin to assist it in comparing performance from period to period and as measures of operational performance. Management believes that these non-GAAP measures provide useful information for investors in evaluating Frontier’s operational performance from period to period because they exclude depreciation and amortization expenses related to investments made in prior periods and are determined without regard to capital structure or investment activities. By excluding capital expenditures, debt repayments and dividends, among other factors, these non-GAAP financial measures have certain shortcomings. Management compensates for these shortcomings by utilizing these non-GAAP financial measures in conjunction with the comparable GAAP financial measures.
Management defines operating free cash flow as net cash provided from operating activities less capital expenditures. Management uses operating free cash flow to assist it in comparing liquidity from period to period and to obtain a more comprehensive view of Frontier’s core operations and ability to generate cash flow. Management believes that this non-GAAP measure is useful to investors in evaluating cash available to service debt and pay dividends. This non-GAAP financial measure has certain shortcomings; it does not represent the residual cash flow available for discretionary expenditures, as items such as debt repayments are not deducted in determining such measure. Management compensates for these shortcomings by utilizing this non-GAAP financial measure in conjunction with the comparable GAAP financial measure.
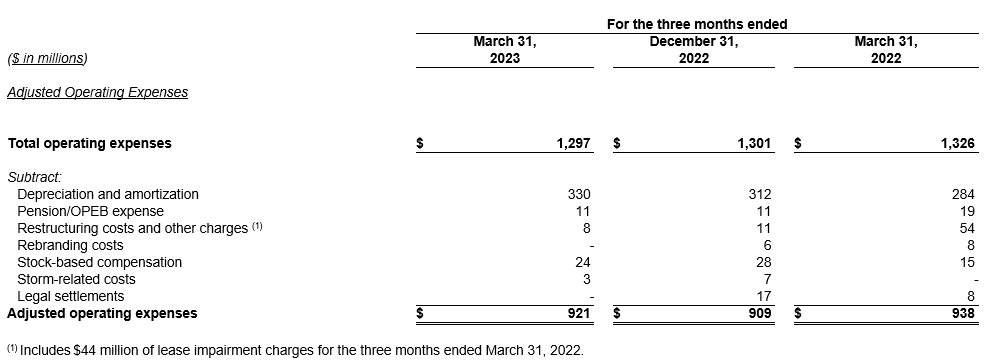
Adjusted operating expenses is defined as operating expenses adjusted to exclude depreciation and amortization, restructuring and other charges, certain pension/OPEB expenses, stock-based compensation, and certain other non-recurring items. Investors have indicated that this non-GAAP measure is useful in evaluating Frontier’s performance.
Net leverage ratio is calculated as net debt (total debt less cash and cash equivalents and short-term investments) divided by Adjusted EBITDA for the most recent four quarters. Investors have indicated that this non-GAAP measure is useful in evaluating Frontier’s debt levels.
The information in this press release should be read in conjunction with the financial statements and footnotes contained in Frontier’s documents filed with the U.S. Securities and Exchange Commission (the “SEC”).
Forward-Looking Statements
This release contains “forward-looking statements” related to future events, including our 2023 outlook and guidance. Forward-looking statements address our expectations or beliefs concerning future events, including, without limitation, our outlook with respect to future operating and financial performance, expected results from our implementation of strategic and cost savings initiatives, capital expenditures, taxes, pension and OPEB obligations, and our ability to comply with the covenants in the agreements governing our indebtedness and other matters. These statements are made on the basis of management’s views and assumptions, as of the time the statements are made, regarding future events and performance and contain words such as “expect,” “anticipate,” “intend,” “plan,” “believe,” “seek,” “see,” “may,” “will,” “would,” or “target.” Forward-looking statements by their nature address matters that are, to different degrees, uncertain. A wide range of factors could materially affect future developments and performance, including but not limited to: our significant indebtedness, our ability to incur substantially more debt in the future, and covenants in the agreements governing our current indebtedness that may reduce our operating and financial flexibility; declines in Adjusted EBITDA relative to historical levels that we are unable to offset; economic uncertainty, volatility in financial markets, and rising interest rates could limit our ability to access capital or increase the cost of capital needed to fund business operations, including our fiber expansion plans; our ability to successfully implement strategic initiatives, including our fiber buildout and other initiatives to enhance revenue and realize productivity improvements; our ability to secure necessary construction resources, materials and permits for our fiber buildout initiative in a timely and cost-effective manner; inflationary pressures on costs and potential disruptions in our supply chain resulting from the global microchip shortage, the COVID-19 pandemic, or otherwise, which could adversely impact our financial condition or results of operations and hinder our fiber expansion plans; our ability to effectively manage our operations, operating expenses, capital expenditures, debt service requirements and cash paid for income taxes and liquidity; the impact of potential information technology or data security breaches or other cyber-attacks or other disruptions; competition from cable, wireless and wireline carriers, satellite, fiber “overbuilders” and over the top companies, and the risk that we will not respond on a timely or profitable basis; our ability to successfully adjust to changes in the communications industry, including the effects of technological changes and competition on our capital expenditures, products and service offerings; our ability to retain or attract new customers and to maintain relationships with existing customers, including wholesale customers; our reliance on a limited number of key supplies and vendors; declines in revenue from our voice services, switched and nonswitched access and video and data services that we cannot stabilize or offset with increases in revenue from other products and services; our ability to secure, continue to use or renew intellectual property and other licenses used in our business; our ability to hire or retain key personnel; our ability to dispose of certain assets or asset groups or to make acquisition of certain assets on terms that are attractive to us, or at all; the effects of changes in the availability of federal and state universal service funding or other subsidies to us and our competitors and our ability to obtain future subsidies; our ability to comply with the applicable CAF II and RDOF requirements and the risk of penalties or obligations to return certain CAF II and RDOF funds; our ability to defend against litigation or government investigations and potentially unfavorable results from current pending and future litigation or investigations; our ability to comply with applicable federal and state consumer protection requirements; the effects of governmental legislation and regulation on our business, including costs, disruptions, possible limitations on operating flexibility and changes to the competitive landscape resulting from such legislation or regulation; the impact of regulatory, investigative and legal proceedings and legal compliance risks; our ability to effectively manage service quality in the states in which we operate and meet mandated service quality metrics or regulatory requirements; the effects of changes in income tax rates, tax laws, regulations or rulings, or federal or state tax assessments, including the risk that such changes may benefit our competitors more than us, as well as potential future decreases in the value of our deferred tax assets; the effects of changes in accounting policies or practices; our ability to successfully renegotiate union contracts; the effects of increased medical expenses and pension and postemployment expenses; changes in pension plan assumptions, interest rates, discount rates, regulatory rules and/or the value of our pension plan assets; the impact of adverse changes in economic, political and market conditions in the areas that we serve, the U.S. and globally, including but not limited to, disruption in our supply chain, inflation in pricing for key materials or labor, or other adverse changes resulting from epidemics, pandemics and outbreaks of contagious diseases, including the COVID-19 pandemic, natural disasters, economic or political instability, terrorist attacks and wars, including the ongoing war in Ukraine, or other adverse widespread developments; potential adverse impacts of climate change and increasingly stringent environmental laws, rules and regulations, and customer expectations; market overhang due to substantial common stock holdings by our former creditors; certain provisions of Delaware law and our certificate of incorporation that may prevent efforts by our stockholders to change the direction or management of our company; and certain other factors set forth in our other filings with the SEC. This list of factors that may affect future performance and the accuracy of forward-looking statements is illustrative and is not intended to be exhaustive. You should consider these important factors, as well as the risks and other factors contained in Frontier’s filings with the SEC, including our most recent reports on Form 10-K and Form 10-Q. These risks and uncertainties may cause actual future results to be materially different than those expressed in such forward-looking statements. We do not intend, nor do we undertake any duty, to update any forward-looking statements.
[1] Adjusted EBITDA and Adjusted EBITDA margin are non-GAAP measures of performance. See “Non-GAAP Measures” for a description of these measures and their calculation. See Schedule A for a reconciliation of Adjusted EBITDA to net income.
[2] Net leverage ratio is a non-GAAP measure. See “Non-GAAP Measures” and the condensed consolidated balance sheet data contained herein for a description and calculation of net leverage ratio.
[3] The operational and financial guidance expectations for 2023 comprise forward-looking statements related to future events. See “Forward-Looking Statements” below. Projected GAAP financial measures and reconciliations of projected non-GAAP financial measures are not provided herein because such GAAP financial measures are not available on a forward-looking basis and such reconciliations could not be derived without unreasonable effort.
Frontier Communications Parent, Inc.
Unaudited Financial Data
Frontier Communications Parent, Inc.
Unaudited Financial Data
Frontier Communications Parent, Inc.
Unaudited Operating Data
Frontier Communications Parent, Inc.
Condensed Consolidated Balance Sheet Data
Frontier Communications Parent, Inc.
Unaudited Consolidated Cash Flow Data
SCHEDULE A
Frontier Communications Parent, Inc.
Unaudited Financial Data
Reconciliation of Non-GAAP Financial Measures
SCHEDULE B
Frontier Communications Parent, Inc.
Unaudited Consolidated Financial Data
Reconciliation of Non-GAAP Financial Measures
SCHEDULE C
Frontier Communications Parent, Inc.
Selected Financial and Operating Data
(Unaudited)