- Delivered first full year of organic Adjusted EBITDA growth in more than 10 years
- Guides to accelerated mid-single-digit Adjusted EBITDA growth in 2024
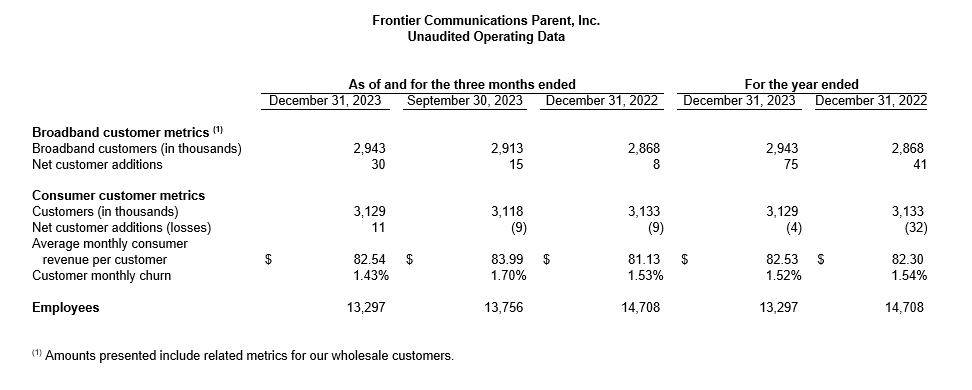
- Reached milestone of two million fiber broadband customers after doubling fiber footprint since 2020
DALLAS, Texas, Feb. 23, 2024 — Frontier Communications Parent, Inc. (NASDAQ: FYBR) (“Frontier”) reported fourth-quarter and full-year 2023 results today.
“Last year, we continued the relentless execution of our strategy, delivered strong financial performance, and achieved our first full year of EBITDA growth in more than a decade,” said Nick Jeffery, President and Chief Executive Officer of Frontier. “In fact, Frontier has delivered the fastest EBITDA growth of any major player in the fixed broadband industry for two consecutive quarters. We believe this year marks a critical inflection point in our business and expect to continue to accelerate EBITDA growth in 2024.”
“We have steadily built a powerful fiber growth engine, and it’s clear that our strategy is working. As evidence, in the fourth quarter we grew consumer fiber broadband revenues by more than 25%, supported by solid customer and ARPU growth. As the largest pure-play fiber internet company in America, we are ideally positioned to enhance the value we provide customers and create sustainable long-term value for shareholders. The future is fiber, and I am excited for what’s ahead as we continue to unlock Frontier’s full potential.”
Full-Year 2023 Highlights
- Passed 1.32 million new fiber locations to reach 6.5 million total fiber locations
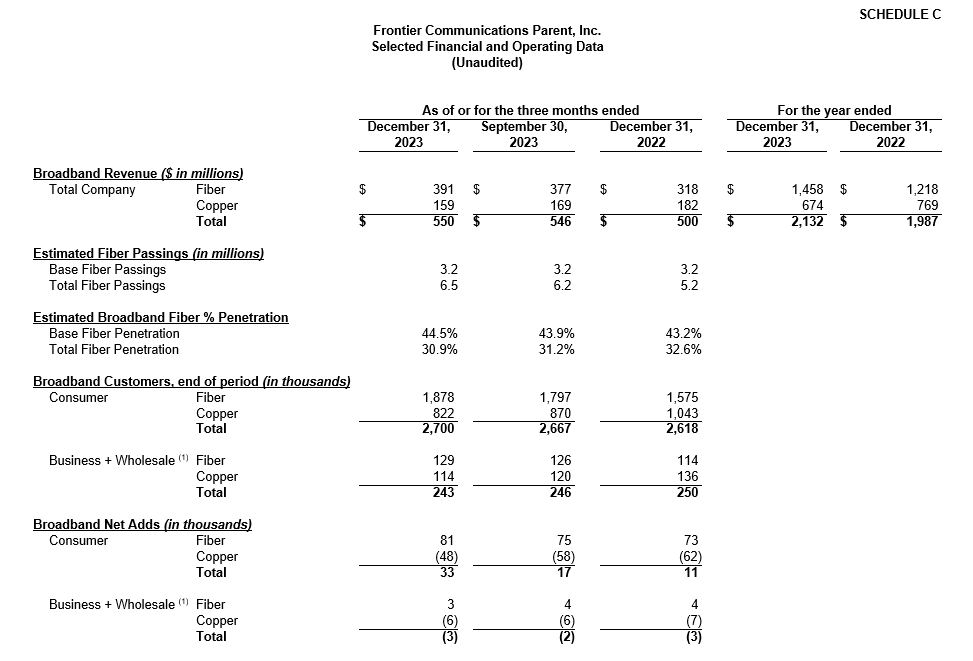
- Added a record 318,000 fiber broadband customers, resulting in fiber broadband customer growth of 19% year-over-year
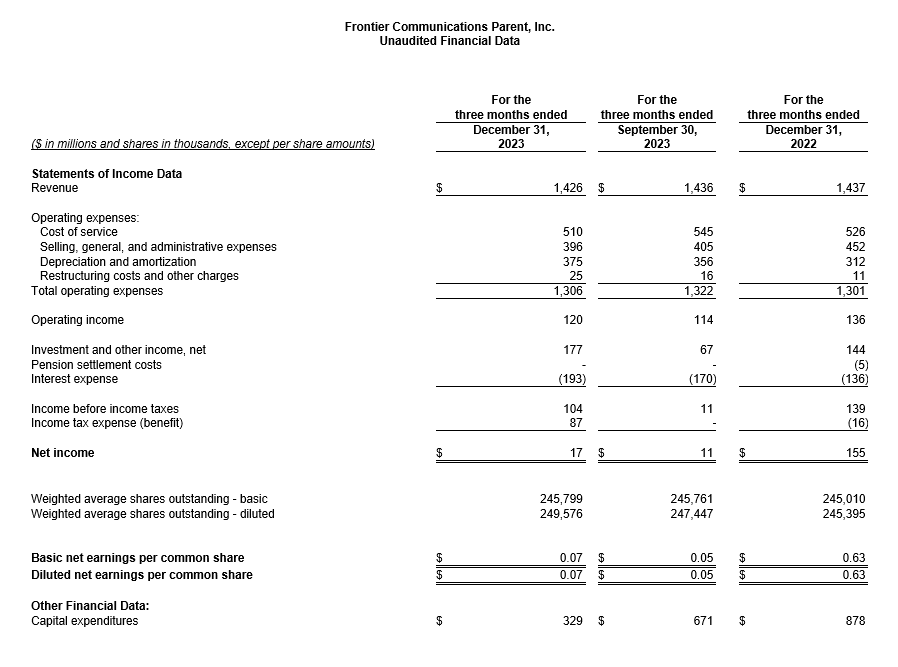
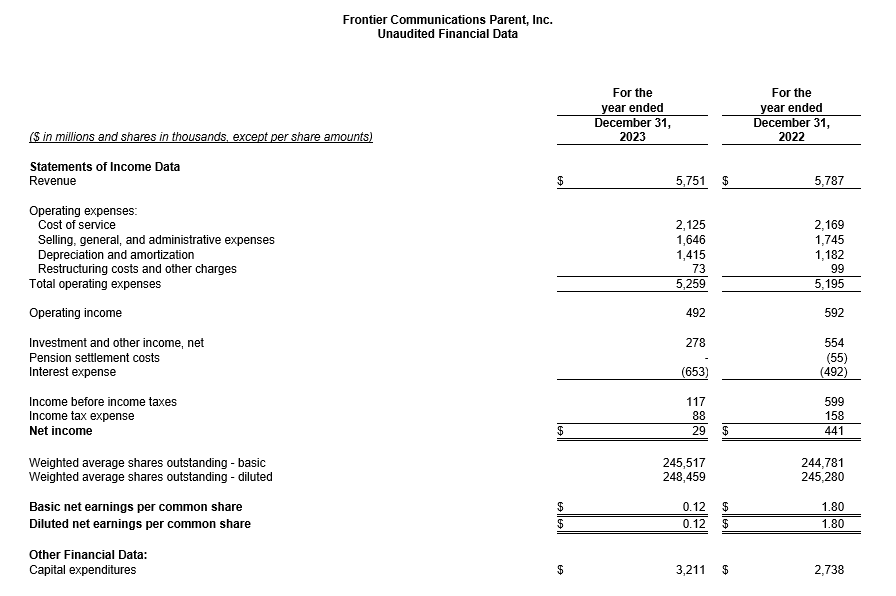
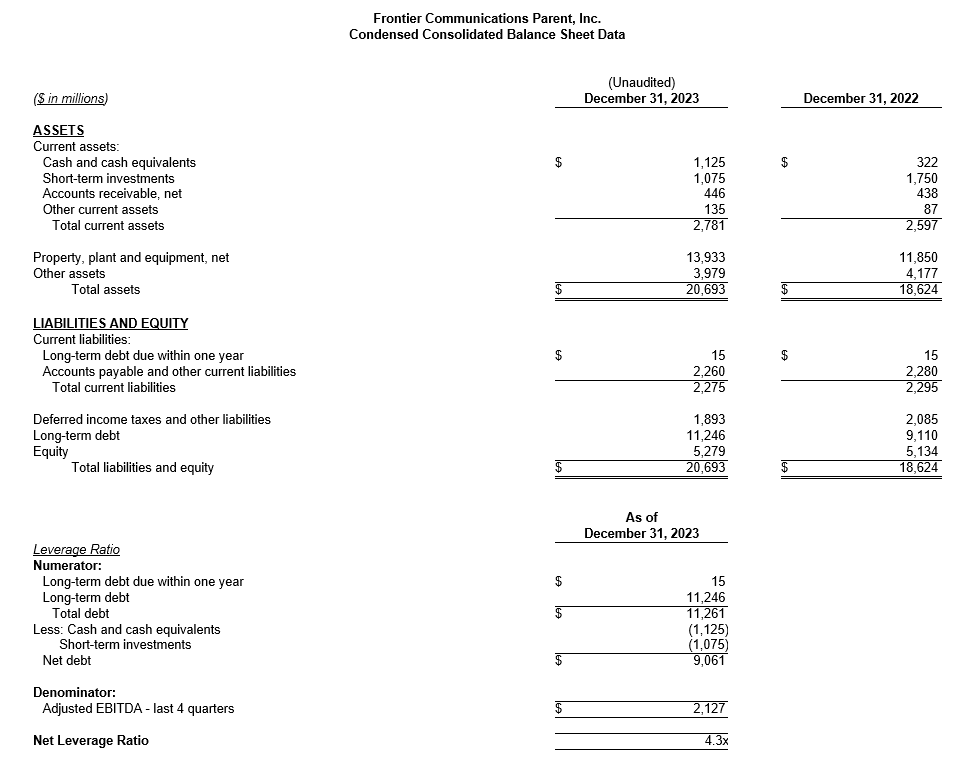
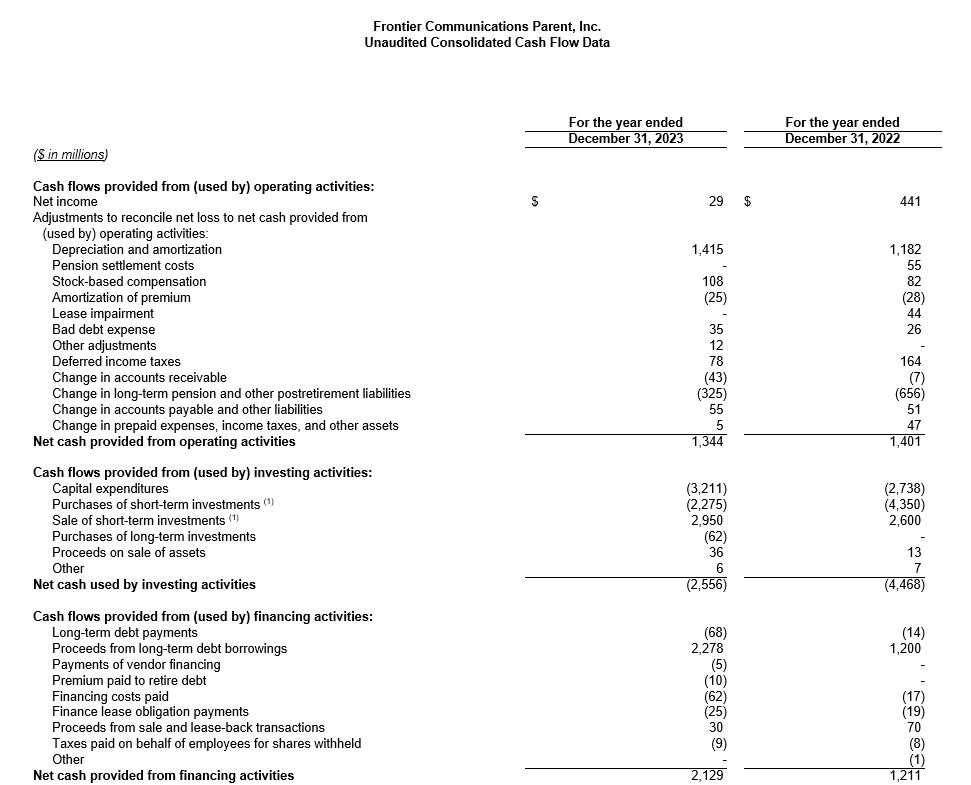
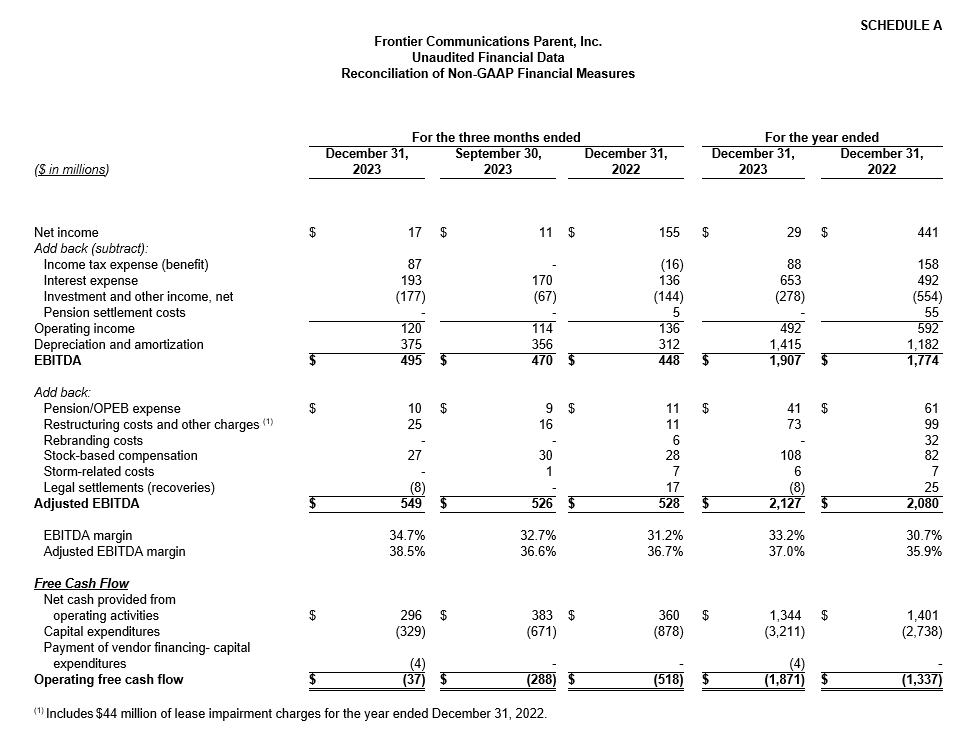
- Delivered revenue of $5.75 billion, net income of $29 million, and Adjusted EBITDA of $2.13 billion1
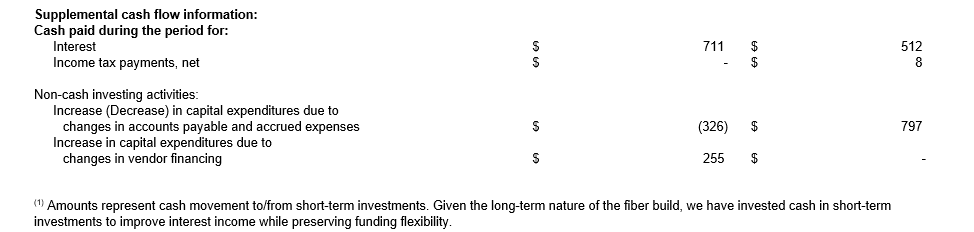
- Executed cash capital expenditures of $3.21 billion plus $4 million of vendor financing payments, for total capital investment of $3.22 billion2
- Generated net cash from operations of $1.34 billion
- Achieved $527 million of gross annualized cost savings, surpassing target of $500 million
- Completed landmark $2.1 billion of fiber securitization transactions
Fourth-Quarter 2023 Highlights
- Passed 333,000 new fiber locations
- Added 84,000 fiber broadband customers
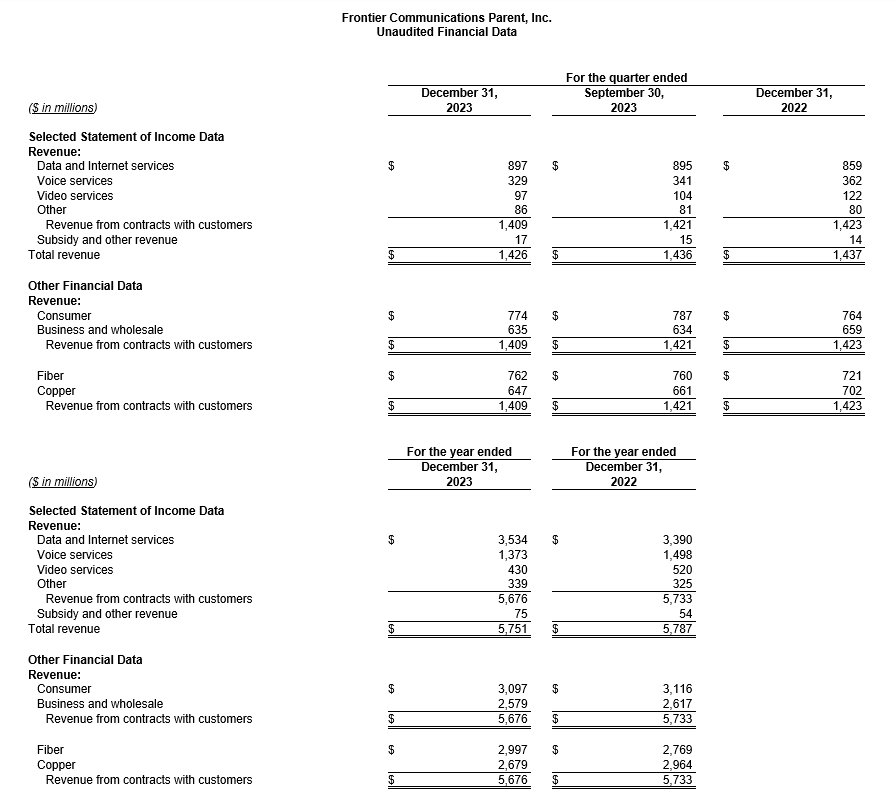
- Revenue of $1.43 billion decreased 0.8% year-over-year as growth in fiber-based products was offset by declines in copper-based products
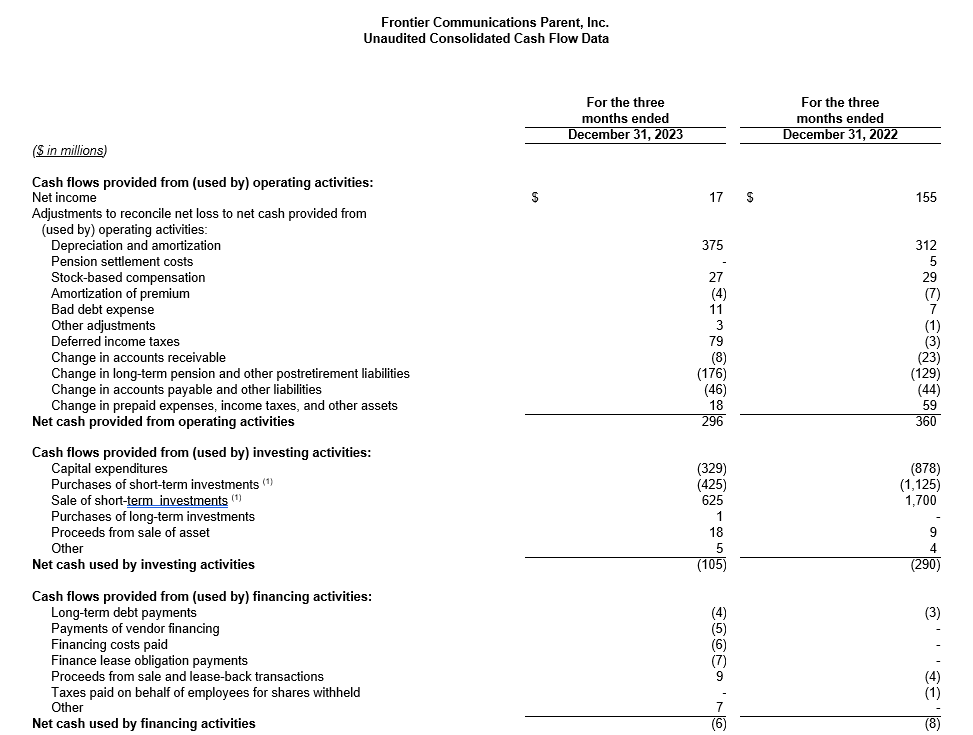
- Operating income of $120 million and net income of $17 million
- Adjusted EBITDA of $549 million increased 4.0% year-over-year, as revenue declines were offset by lower content expenses and cost savings1
- Adjusted EBITDA margin of 38.5% increased from 36.7% in the fourth quarter of 20221
- Executed cash capital expenditures of $329 million plus $4 million of vendor financing payments, for total capital investment of $333 million2
- Generated net cash from operations of $296 million
Fourth-Quarter 2023 Consumer Results
- Consumer revenue of $774 million increased 1.3% year-over-year as strong growth in fiber broadband was partly offset by declines in copper products
- Consumer fiber revenue of $484 million increased 11.0% year-over-year as growth in broadband was partly offset by declines in video, voice, and other
- Consumer fiber broadband revenue of $354 million increased 25.1% year-over-year driven by growth in both fiber broadband customers and ARPU
- Consumer fiber broadband customer net additions of 81,000 resulted in consumer fiber broadband customer growth of 19.2% year-over-year
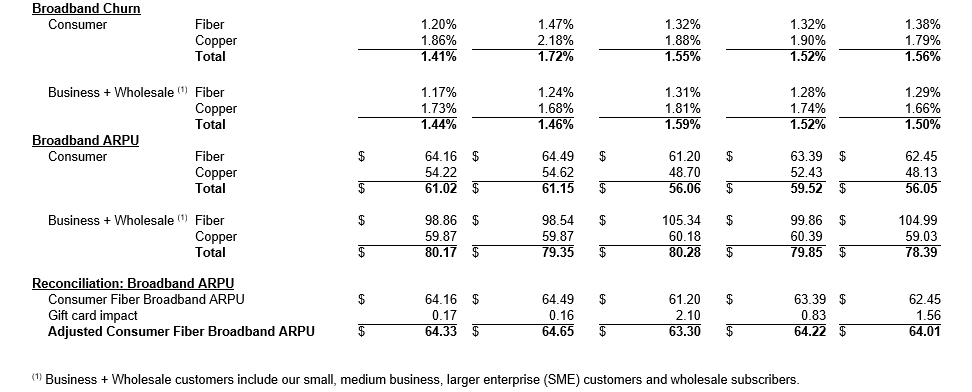
- Consumer fiber broadband customer churn of 1.20% decreased from 1.32% in the fourth quarter of 2022
- Consumer fiber broadband ARPU of $64.16 increased 4.8% year-over-year, due to increased customer in-take ARPU and annual price increases
Fourth-Quarter 2023 Business and Wholesale Results
- Business and Wholesale revenue of $635 million decreased 3.6% year-over-year driven by declines in both fiber and copper
- Business and Wholesale fiber revenue of $278 million decreased 2.5% year-over-year as growth in data and voice was offset by declines in other, which were primarily driven by one-time benefits in the fourth quarter of 2022 that did not repeat
- Business and Wholesale fiber broadband customer net additions of 3,000 resulted in Business and Wholesale fiber broadband customer growth of 13.2% year-over-year
- Business and Wholesale fiber broadband customer churn of 1.17% decreased from 1.31% in the fourth quarter of 20223
- Business and Wholesale fiber broadband ARPU of $98.86 decreased 6.2% year-over-year4
Capital Structure
As of December 31, 2023, Frontier had total liquidity of $3.2 billion, including a cash and short-term investments balance of approximately $2.2 billion, $0.5 billion of available borrowing capacity on its revolving credit facility, and $0.5 billion of available borrowing capacity on its variable funding notes facility, subject to customary drawing conditions. Frontier’s net leverage ratio on December 31, 2023, was approximately 4.3x5. Frontier has no long-term debt maturities prior to 2027.
2024 Outlook6
Frontier’s guidance for the full year 2024 is:
- Adjusted EBITDA of $2.20 – $2.25 billion1
- New fiber passings of 1.3 million
- Cash capital investment of $3.00 – $3.20 billion2
- Cash taxes of approximately $20 million
- Net cash interest payments of approximately $750 million
- Pension and OPEB expense of approximately $40 million (net of capitalization)
- Cash pension and OPEB contributions of approximately $125 million
Conference Call Information
As previously announced, Frontier will host a conference call to discuss fourth-quarter and full-year 2023 results today, February 23, 2024, beginning at 8:30 a.m. Eastern Time.
The conference call webcast and presentation materials are accessible through Frontier’s Investor Relations website and will remain archived at this location.
Investor Contact
Spencer Kurn
SVP, Investor Relations
+1 401-225-0475
spencer.kurn@ftr.com
Media Contact
Chrissy Murray
VP, Corporate Communications
+1 504-952-4225
chrissy.murray@ftr.com
About Frontier
Frontier (NASDAQ: FYBR) is the largest pure-play fiber provider in the U.S. Driven by our purpose, Building Gigabit America®, we deliver blazing-fast broadband connectivity that unlocks the potential of millions of consumers and businesses. For more information, visit www.frontier.com.
Non-GAAP Financial Measures
Frontier uses certain non-GAAP financial measures in evaluating its performance, including EBITDA, EBITDA margin, Adjusted EBITDA, Adjusted EBITDA margin, operating free cash flow, adjusted operating expenses, and net leverage ratio, each of which is described below. Management uses these non-GAAP financial measures internally to (i) assist in analyzing Frontier’s underlying financial performance from period to period, (ii) analyze and evaluate strategic and operational decisions, (iii) establish criteria for compensation decisions, and (iv) assist in the understanding of Frontier’s ability to generate cash flow and, as a result, to plan for future capital and operational decisions. Management believes that the presentation of these non-GAAP financial measures provides useful information to investors regarding Frontier’s financial condition and results of operations because these measures, when used in conjunction with related GAAP financial measures, (i) provide a more comprehensive view of Frontier’s core operations and ability to generate cash flow, (ii) provide investors with the financial analytical framework upon which management bases financial, operational, compensation, and planning decisions, and (iii) present measurements that investors and rating agencies have indicated to management are useful to them in assessing Frontier and its results of operations.
A reconciliation of these measures to the most comparable financial measures calculated and presented in accordance with GAAP is included in the accompanying tables. These non-GAAP financial measures are not measures of financial performance or liquidity under GAAP, nor are they alternatives to GAAP measures, and they may not be comparable to similarly titled measures of other companies.
EBITDA is defined as net income (loss) less income tax expense (benefit), interest expense, investment and other income (loss), pension settlement costs, reorganization items, and depreciation and amortization. EBITDA margin is calculated by dividing EBITDA by total revenue.
Adjusted EBITDA is defined as EBITDA, as described above, adjusted to exclude certain pension/OPEB expenses, restructuring costs and other charges, stock-based compensation, and certain other non-recurring items. Adjusted EBITDA margin is calculated by dividing Adjusted EBITDA by total revenue.
Management uses EBITDA, EBITDA margin, Adjusted EBITDA and Adjusted EBITDA margin to assist it in comparing performance from period to period and as measures of operational performance. Management believes that these non-GAAP measures provide useful information for investors in evaluating Frontier’s operational performance from period to period because they exclude depreciation and amortization expenses related to investments made in prior periods and are determined without regard to capital structure or investment activities. By excluding capital expenditures, debt repayments and dividends, among other factors, these non-GAAP financial measures have certain shortcomings. Management compensates for these shortcomings by utilizing these non-GAAP financial measures in conjunction with the comparable GAAP financial measures.
Management defines operating free cash flow as net cash provided from operating activities less capital expenditures, less payments on vendor financing related to capital expenditures. Management uses operating free cash flow to assist it in comparing liquidity from period to period and to obtain a more comprehensive view of Frontier’s core operations and ability to generate cash flow. Management believes that this non-GAAP measure is useful to investors in evaluating cash available to service debt and pay dividends. This non-GAAP financial measure has certain shortcomings; it does not represent the residual cash flow available for discretionary expenditures, as items such as debt repayments are not deducted in determining such measure. Management compensates for these shortcomings by utilizing this non-GAAP financial measure in conjunction with the comparable GAAP financial measure.
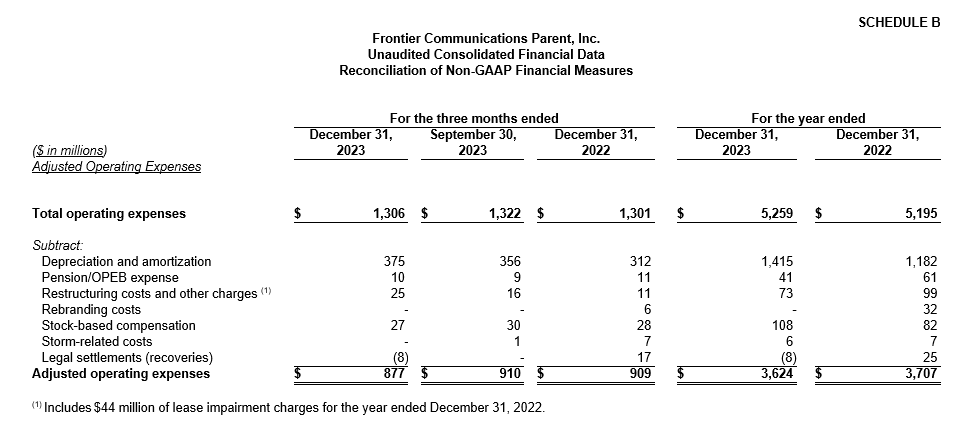
Adjusted operating expenses is defined as operating expenses adjusted to exclude depreciation and amortization, restructuring and other charges, certain pension/OPEB expenses, stock-based compensation, and certain other non-recurring items. Investors have indicated that this non-GAAP measure is useful in evaluating Frontier’s performance.
Net leverage ratio is calculated as net debt (total debt less cash and cash equivalents and short-term investments) divided by Adjusted EBITDA for the most recent four quarters. Investors have indicated that this non-GAAP measure is useful in evaluating Frontier’s debt levels.
The information in this press release should be read in conjunction with the financial statements and footnotes contained in Frontier’s documents filed with the U.S. Securities and Exchange Commission (the “SEC”).
Forward-Looking Statements
This release contains “forward-looking statements” related to future events, including our 2024 outlook and guidance. Forward-looking statements address our expectations or beliefs concerning future events, including, without limitation, our outlook with respect to future operating and financial performance, expected results from our implementation of strategic and cost savings initiatives, planned financings, capital expenditures, taxes, pension and OPEB obligations, and our ability to comply with the covenants in the agreements governing our indebtedness and other matters. These statements are made on the basis of management’s views and assumptions, as of the time the statements are made, regarding future events and performance and contain words such as “expect,” “anticipate,” “intend,” “plan,” “believe,” “seek,” “see,” “may,” “will,” “would,” or “target.” Forward-looking statements by their nature address matters that are, to different degrees, uncertain. A wide range of factors could materially affect future developments and performance, including but not limited to: our significant indebtedness, our ability to incur substantially more debt in the future, and covenants in the agreements governing our current indebtedness that may reduce our operating and financial flexibility; declines in Adjusted EBITDA and revenue relative to historical levels that we are unable to offset; economic uncertainty, volatility in financial markets, and rising interest rates could limit our ability to access capital or increase the cost of capital needed to fund business operations, including our fiber expansion plans; our ability to successfully implement strategic initiatives, including our fiber buildout and other initiatives to enhance revenue and realize productivity improvements; our ability to secure necessary construction resources, materials and permits for our fiber buildout initiative in a timely and cost-effective manner; inflationary pressures on costs, including tight labor markets, increased fuel and electricity costs and potential disruptions in our supply chain, which could adversely impact our financial condition or results of operations and hinder our fiber expansion plans; our ability to effectively manage our operations, operating expenses, capital expenditures, debt service requirements and cash paid for income taxes and liquidity; the impact of potential information technology or data security breaches or other cyber-attacks or other disruptions; the impact of laws and regulations relating to the handling of privacy and data protection; competition from cable, wireless carriers, satellite providers, wireline carriers, fiber “overbuilders” and over the top companies, and the risk that we will not respond on a timely or profitable basis; our ability to successfully adjust to changes in the communications industry, including the effects of technological changes and competition on our capital expenditures, products and service offerings; our ability to retain or attract new customers and to maintain relationships with existing customers, including wholesale customers; our reliance on a limited number of key supplies and vendors; declines in revenue from our voice services, switched and nonswitched access and video and data services that we cannot stabilize or offset with increases in revenue from other products and services; our ability to secure, continue to use or renew intellectual property and other licenses used in our business; our ability to hire or retain key personnel; our ability to dispose of certain assets or asset groups or to make acquisition of certain assets on terms that are attractive to us, or at all; the effects of changes in the availability of federal and state universal service funding or other subsidies to us and our competitors and our ability to obtain future subsidies; our ability to comply with the applicable CAF II and RDOF requirements and the risk of penalties or obligations to return certain CAF II and RDOF funds; our ability to defend against litigation or government investigations and potentially unfavorable results from current pending and future litigation or investigations; our ability to comply with applicable federal and state consumer protection requirements; the effects of governmental legislation and regulation on our business, including costs, disruptions, possible limitations on operating flexibility and changes to the competitive landscape resulting from such legislation or regulation; the impact of regulatory, investigative and legal proceedings and legal compliance risks; our ability to effectively manage service quality in the states in which we operate and meet mandated service quality metrics or regulatory requirements; the effects of changes in income tax rates, tax laws, regulations or rulings, or federal or state tax assessments, including the risk that such changes may benefit our competitors more than us, as well as potential future decreases in the value of our deferred tax assets; the effects of changes in accounting policies or practices; our ability to successfully renegotiate union contracts; the effects of increased medical expenses and pension and postemployment expenses; changes in pension plan assumptions, interest rates, discount rates, regulatory rules and/or the value of our pension plan assets; the impact of adverse changes in economic, political and market conditions in the areas that we serve, the U.S. and globally, including but not limited to, disruption in our supply chain, inflation in pricing for key materials or labor, or other adverse changes resulting from epidemics, pandemics and outbreaks of contagious diseases, natural disasters, economic or political instability, terrorist attacks and wars, including the ongoing war in Ukraine and the Israel-Hamas war, or other adverse widespread developments; potential adverse impacts of climate change and increasingly stringent environmental laws, rules and regulations, and customer expectations and other environmental liabilities; market overhang due to substantial common stock holdings by our former creditors; certain provisions of Delaware law and our certificate of incorporation that may prevent efforts by our stockholders to change the direction or management of our company; and certain other factors set forth in our other filings with the SEC. This list of factors that may affect future performance and the accuracy of forward-looking statements is illustrative and is not intended to be exhaustive. You should consider these important factors, as well as the risks and other factors contained in Frontier’s filings with the SEC, including our most recent reports on Form 10-K and Form 10-Q. These risks and uncertainties may cause actual future results to be materially different than those expressed in such forward-looking statements. We do not intend, nor do we undertake any duty, to update any forward-looking statements.
[1] Adjusted EBITDA is a non-GAAP measure of performance. See “Non-GAAP Measures” for a description of this measure and its calculation. See Schedule A for a reconciliation of Adjusted EBITDA to net income.
[2] Cash capital investment includes capital expenditures and vendor financing payments for capital spend.
[3] Business and Wholesale churn has been updated for new methodology which includes wholesale, excluding circuits or fiber-to-the-tower churn.
[4] Business and Wholesale ARPU has been updated for new methodology which includes wholesale, excluding circuits or fiber-to-the-tower ARPU.
[5] Net leverage ratio is a non-GAAP measure. See “Non-GAAP Measures” and the condensed consolidated balance sheet data contained herein for a description and calculation of net leverage ratio.
[6] The operational and financial guidance expectations for 2024 comprise forward-looking statements related to future events. See “Forward-Looking Statements” below. Projected GAAP financial measures and reconciliations of projected non-GAAP financial measures are not provided herein because such GAAP financial measures are not available on a forward-looking basis and such reconciliations could not be derived without unreasonable effort.